Measuring the Drought: How Farmers and Ranchers Can Report on Drought Impacts
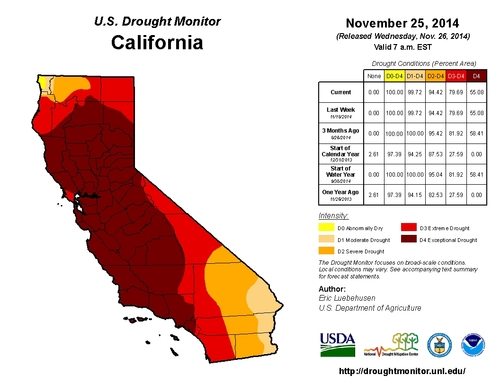
In early November, the California Rangeland Watershed Laboratory at UC Davis hosted a workshop/webinar entitled “Ranching and California's Drought” (for videos of the presentations, CLICK HERE). For me, one of the most interesting parts of the workshop was a panel discussion featuring several of the authors of the U.S. Drought Monitor (go to http://droughtmonitor.unl.edu/ for more information about the Drought Monitor). According to the Drought Monitor website:
“The U.S. Drought Monitor, established in 1999, is a weekly map of drought conditions that is produced jointly by the National Oceanic and Atmospheric Administration, the U.S. Department of Agriculture, and the National Drought Mitigation Center (NDMC) at the University of Nebraska-Lincoln. The U.S. Drought Monitor website is hosted and maintained by the NDMC.
“U.S. Drought Monitor maps come out every Thursday morning at 8:30 eastern time, based on data through 7 a.m. the preceding Tuesday. The map is based on measurements of climatic, hydrologic and soil conditions as well as reported impacts and observations from more than 350 contributors around the country. Eleven climatologists from the partner organizations take turns serving as the lead author each week. The authors examine all the data and use their best judgment to reconcile any differences in what different sources are saying.”
This weekly map is important for several reasons, not the least of which is the fact that it is increasingly used to determine eligibility for government-funded drought relief programs for farmers and ranchers. It's also used by the Internal Revenue Service to determine how long a rancher who has sold breeding stock can defer his or her capital gains tax bill. I learned during the workshop that the Drought Monitor authors rely on on-the-ground observations as well as remotely-sensed data on soil moisture, precipitation, vegetation and a variety of other factors. Most applicable to me, the panel discussed ways that farmers and ranchers can provide real-world information to the Drought Monitor, which will help them improve its accuracy and timeliness.
What types of information are useful?
Obviously, on-the-ground information about precipitation is critical information. Rainfall and snowfall amounts can vary greatly over short distances, and actual precipitation totals are an important dataset for the Drought Monitor. Most of us have rain gauges – we should be recording daily rain and snowfall totals for our own records!
The panel indicated that information on forage production and other vegetation responses to precipitation are most useful when placed in historical context – in other words, reporting that our annual rangelands produced 2,000 pounds of forage per acre in 2014 isn't as useful as providing documentation that last year's forage production was 77 percent of the historic average. That said, many of us have taken photographs of our farm or ranch on an annual basis – and these photographs often show differences in vegetation from one year to the next. I've started using an iPhone application called GrassSnap (go to http://centralsandhills.unl.edu/GrassSnap for more information) that allows me to take repeatable photographs from a specific spot. I'm going to start taking these photos of our home pasture on the first of every month – a quick and easy way to track forage production from month-to-month and year-to-year.
Another useful bit of data that I've been tracking (without realizing it might be important to the Drought Monitor) are bloom and leaf-out dates for some of the landscaping plants at our home. I've recorded the bloom dates for our lilacs for the last 13 years. I've also recorded bloom dates for our daffodils. Weather and soil moisture can impact these dates, and this information (because I've got some historical context for it) is useful for the Drought Monitor. I've also recorded the dates when I first see the blue oaks starting to leaf out – another helpful indicator. We have four enormous mulberry trees in our yard – I've generally tried to record the date when they've finally dropped all of the leaves (and when we can stop raking them up!). All of this information is related to our weather conditions.
Speaking of dates, there are other useful weather and climate related dates we might record - the date of the first killing frost, for example. I've also recorded the date when I first hear or see the sandhill cranes flying over – either on their trip north in the early spring or their return trip south in the early fall. There may be other types of migratory wildlife on our farms and ranches that can help provide some indication of weather and climatic conditions. The dates when creeks start or stop running are useful information, as are the dates when vernal pools or stockponds start to fill or become dry.

I'm incredibly busy – why should I take time to observe and report conditions? Isn't that the government's job?!
All of us are busy – ranching and farming provide “opportunities” to work more than full time for most of us! Recording the types of information I've listed above takes time, as does submitting reports to the Drought Monitor. While improving the accuracy of the Drought Monitor is an important goal on its own, I've found that recording this data helps me become a better manager. For example, tracking rainfall totals last year helped me identify some critical dates for making decisions about stocking rates based on what our forage production was likely to be two or three months in the future. Someone once said that drought can sneak up on you – it's not like a snowstorm that's predicted days or weeks in advance. Keeping track helps reduce the element of surprise!
For me, at least, recording and reporting my observations is important psychologically, too. Most of us probably experienced a feeling of helplessness at some point last winter when we were in the midst of our 50-plus day dry spell. No matter how hard I tried, I couldn't make it rain. Keeping track of weather and climatic conditions – and reporting on these conditions to the Drought Monitor – gave me something useful to do. This might seem like a stretch, but there's something to it, at least for me – doing something is better than doing nothing!
How can I report drought impacts and conditions to the Drought Monitor?
There are several formal avenues for reporting impacts and conditions to the Drought Monitor. First, the National Drought Mitigation Center maintains a drought impacts reporting website (go to http://droughtreporter.unl.edu/). By clicking on the “Submit a Report” button at the top of the page, you can follow the simple, on-screen directions to submit your observation. The site is moderated, which means someone at the Center reviews each report and determines whether it can be considered a drought “impact” which can be used to inform the drought monitor map. Again, historical context is important - when you make a report, compare current conditions to previous years. For instance, you might report that a particular creek has never gone dry in the 50 years you've observed it. You can submit regular monthly observations as a “condition report ” to help build a historic record; summary information, such as how forage production compares to the historic average; or other observations or qualitative information on how drought conditions differ from normal.
I've also created an account on the Community Collaborative Rain, Hail and Snow Network (http://www.cocorahs.org/). This website allows me to report daily precipitation observations. To ensure uniformity, the network asks members to use a specific rain gauge (and a link to an affordable source of these gauges is provided). The Drought Monitor authors do review precipitation reports on the network website as they make their weekly updates. As an admitted weather nerd, I've also found the daily precipitation maps generated on this website to be very interesting – it's just one more way of “looking over the fence” to see what's happening at the neighbors!
The importance of our stories!
Finally, qualitative information about the drought is just as important as quantitative data. Our stories have importance, too – both for current research and future generations. This drought is the most severe in a generation. We need to share our stories with our families and with our neighbors – the colors on the Drought Monitor map will only impact public policy if we are willing to share the real-world effects on our land, our businesses, our families and our communities. Fortunately, most of us have access to technological tools that make recording our stories easy. One of the best sites I've seen for recording these stories is the SoundCloud Voices from the Drought site moderated by Brad Hooker at the UC Davis Plant Sciences Department. For more information about the project, go to //ucanr.edu/blogs/blogcore/postdetail.cfm?postnum=13098. To listen to the Voices from the Drought stories, go to https://soundcloud.com/groups/farmer-and-rancher-voices-from-the-drought.
Dan Macon is a Community Education Specialist in the Placer/Nevada office of UC Cooperative Extension. Dan and his family also operate Flying Mule Farm, a small-scale commercial sheep ranch in the Sierra Nevada foothills. For more information, go to www.flyingmule.blogspot.com.


